Monitoring Blood Glucose in Patients With Diabetes Mellitus
Thomas Schermerhorn, VMD, DACVIM (SAIM), Kansas State University
A long-term patient monitoring strategy that is clinically sound, practical, and effective should be developed for every patient with diabetes mellitus (DM). A close clinician–pet owner relationship is critical to success, as the pet owner provides daily care and performs most day-to-day monitoring. Owners should be educated to recognize early signs of problems with DM management and to communicate their observations to the veterinary team. Routine physical examinations and laboratory testing are also critical and present opportunities to discuss progress, troubleshoot problems, and assess quality of life. Restoring and maintaining patient quality of life is a paramount concern of most owners1,2 and should be a foundational goal of any monitoring strategy.
Optimal glycemic control requires appropriate insulin therapy to control hyperglycemia and avoid hypoglycemia and other complications. Various laboratory tests and clinical tools are available and appropriate for monitoring3,4; however, no single method or combination has been shown to have clear, significant clinical benefits. Therefore, the monitoring program should be practical and the components tailored to meet individual patient needs and owner abilities, circumstances, and treatment goals. Recommendations for DM monitoring in dogs and cats are typically based on expert advice and experience, and published consensus guidelines are available.5 Elimination of clinical signs of DM is an acceptable and achievable goal for most patients, but various monitoring strategies can be used to achieve acceptable glycemia. Interventions should be performed frequently enough to be effective but not so often that they are impractical or inconvenient for the owner.
Monitoring Methods
Monitoring DM involves several direct and indirect methods for assessing glycemic control (Table 1). Direct monitoring uses a quantitative method to determine blood glucose (BG; eg, spot or random BG sampling, BG curve, interstitial glucose monitoring [IGM]). Indirect monitoring evaluates a subjective (eg, physical examination findings, clinical signs) or objective (eg, quantitative measurements of hemoglobin A1c [HbA1c] or fructosamine) parameter influenced by BG rather than glucose itself. Monitoring for the typical DM patient should incorporate several methods, each with advantages and disadvantages (Table 2).
Table 1: Diabetes Mellitus Monitoring Methods
Table 2: Advantages & Disadvantages of Diabetes Mellitus Monitoring Methods
Assessment of Clinical Signs
Polydipsia and polyuria are commonly observed clinical signs of DM that are directly related to the magnitude of hyperglycemia but are of limited sensitivity and specificity. Hyperglycemia results in plasma hypertonicity, which stimulates thirst and promotes volume loss via osmotic diuresis and glucosuria once the renal threshold for glucose reabsorption is exceeded.
Appetite, body weight, and body condition can also provide clues to glycemic control. Appetite persists in most diabetic dogs and cats, but body weight and condition are abnormal in many patients at the time of diagnosis; they may be improved through insulin therapy and glycemic control. Poor glycemic control should be suspected if a patient’s weight/condition does not improve or begins to decline during therapy. The monitoring strategy must detect deviations from a patient’s normal condition (see Benefits of Monitoring for Clinical Signs). Owners should be made aware of signs of poor glycemic control and instructed to observe water consumption, voiding habits, and appetite, along with body condition, weight, and overall health. Concerning trends or indicators should be shared with the clinician.
Benefits of Monitoring for Clinical Signs
The usefulness of monitoring for clinical signs caused by hyperglycemia is 2-fold:
A significant disturbance in BG can be inferred from the persistence or emergence of clinical signs during treatment (the renal threshold for glucose is ≈200 mg/dL in dogs and ≈250 mg/dL in cats).5
Evidence shows a positive correlation between objective measures (ie, serum fructosamine and mean 8-hour BG concentration) and owner assessment of control based on clinical signs.25
Careful, frequent evaluation of clinical signs is an important part of monitoring BG and protecting overall health.25 DM is a primary cause of cataracts in dogs and a cause of peripheral neuropathy in dogs and cats.26,27 Thus, signs of these conditions and other common diabetic complications or concurrent disorders (eg, pancreatitis, renal failure, endocrinopathy, neoplasia) should be included in monitoring.26-28
Urine Monitoring
Urine testing for glucose and ketones in DM is used to detect changes in health status before clinical signs appear. Abrupt changes in the magnitude of glucosuria or emergence of ketonuria can signal a recent disruption in glycemic control, but this advantage may not be realized in practice, as outward clinical signs often precede detection of altered urine glucose or ketone concentrations in urine. In addition, urine testing can have several drawbacks (eg, difficulty in obtaining a sample for testing, leading to poor compliance).6 Overall, this method is not recommended for DM monitoring; it may be useful in some circumstances but must be interpreted in context of other findings.6
Glycated Proteins
Proteins exposed to glucose are altered via a nonenzymatic chemical reaction. The concentration of these glycated proteins in blood increases with the circulating BG concentration. Because glycated proteins are metabolized in the same manner as nonglycated proteins, their concentration in the circulation reflects the average BG over the lifespan of the parent protein. Serum fructosamine and HbA1c are the major glycated proteins in dogs and cats; monitoring these blood concentrations can provide insight about glycemic control and response to insulin.
Fructosamine values represent the concentrations of several glycated serum proteins, but glycated albumin makes up the largest portion.7 In dogs and cats, fructosamine concentration is frequently used to monitor DM and is interpreted to reflect average glycemia over the previous 2 weeks, which is the approximate lifespan of serum albumin. HbA1c is a specific glycated hemoglobin moiety used extensively for monitoring glycemia in humans with DM but is used less frequently in veterinary medicine. Due to hemoglobin’s longer serum lifetime, HbA1c levels reflect average serum glucose over the erythrocyte lifespan in circulation (dogs, ≤120 days; cats, ≈70 days).8 Although HbA1c represents glycemia over a substantially longer time than fructosamine, acute, short-term disruptions in glycemic control affect fructosamine sooner than HbA1c (see Drawbacks of Glycated Protein Monitoring). A reduction in fructosamine and HbA1c concentrations is expected with successful insulin therapy.7,9
Clinicians have traditionally relied on fructosamine measurement rather than other moieties partly due to the widespread commercial availability of fructosamine assays. However, recent studies have underscored the possible advantage of HbA1c for assessing glycemic control in dogs,10-13 and commercial assays are available for assessing canine and feline HbA1c.
Drawbacks of Glycated Protein Monitoring
Medical conditions that alter concentrations of the parent protein also affect the glycated versions. Fructosamine reduction occurs in nondiabetic dogs with hypoproteinemia or hypoalbuminemia and in those with hyperlipidemia and/or azotemia.29 Fructosamine is also reduced in cats as a consequence of increased protein turnover associated with concurrent hyperthyroidism,30 although it may remain within the reference range.31 Many of the conditions affecting fructosamine also affect HbA1c, but HbA1c concentration is also altered by anemia and other conditions that influence RBC turnover.32
Blood Glucose
Direct determination of BG is the gold standard for immediate and real-time assessment of glycemia. In diabetic patients, BG monitoring over time reflects pharmacodynamic actions of insulin and can provide information about onset, peak activity, and duration of action, as well as its overall effectiveness in controlling glycemia. The BG curve has been the traditional approach used to document patient insulin response, but IGM has become more commonplace. Randomly timed, single determinations of BG concentration (ie, spot measurement) have little interpretive value and are not recommended when making decisions about insulin dose.
The Blood Glucose Curve
This method involves sampling and testing every 1 to 2 hours over a defined time (usually 12 hours but sometimes longer) to plot BG, typically using a portable glucometer. Venous or capillary blood samples from various sites (eg, small vein, ear tip, paw pad) are obtained manually using a needle or lancet. The number of points on the curve is determined by the sampling frequency. The BG curve is most often performed in clinic, but some clinicians recommend owners learn to do it at home. A review of the background, method, and interpretation of the BG curve is available.14
Interstitial Glucose Monitoring
IGM allows for measurement of glucose concentration in interstitial fluid over days to weeks.15 IGM includes both continuous and flash glucose monitoring (FGM) methods. Continuous glucose monitoring automatically displays each glucose measurement for users in real time and can integrate with insulin pump systems to adjust insulin dosing, whereas FGM displays a single value result only when the sensor is interrogated by the reader (see Interstitial Glucose Monitoring Systems). IGM provides values for glucose that differ from those of capillary or venous blood.16 The gradient between blood and interstitial glucose, which can range from 20% to 110%,16 is greatest when large fluctuations in BG (increasing or decreasing) occur and there is a lag (minutes) before the 2 compartments equilibrate. Thus, IGM may underreport rapid changes in BG, which is particularly important when there is risk for development of hypoglycemia.
Monitoring performed by pet owners is a viable way for the clinician to obtain BG information.17,18 In a study, ≈85% of owners were successful with long-term home BG monitoring that required frequent blood sampling to produce curves.19 Anecdotal reports indicate owners and clinicians are willing to use IGM to perform at-home monitoring; this is especially true when an FGM device is used, as these systems do not require frequent calibration and data can be easily retrieved and analyzed. A particular advantage of FGM systems is that daily glycemic data can help facilitate treatment to achieve clinical goals rather than just elimination of clinical signs. For example, insulin treatment can be adjusted more frequently based on glycemic data and metabolic targets (eg, desired range for average daily glucose).
Interstitial Glucose Monitoring Systems
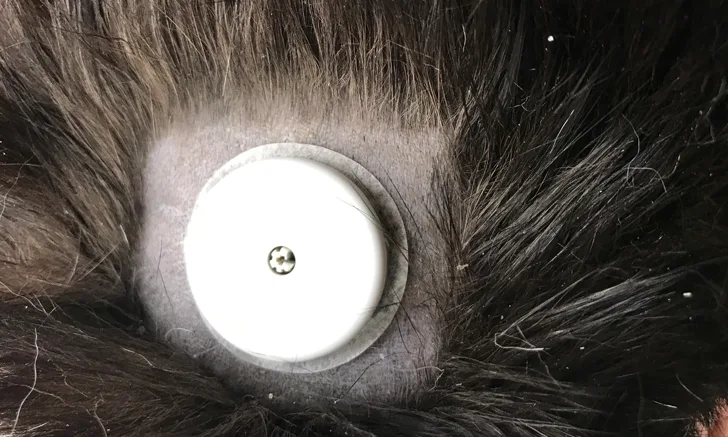
IGM has been used in veterinary medicine for >15 years.33 Several systems studied have proven useful in dogs and cats.34 Advances in technology have rendered IGM systems more user friendly and better suited for veterinary applications. A newer FGM system has shown promise in veterinary medicine, although published information is limited to a single study.35 All commercial IGM systems involve similar components and operating principles.15 The basic unit consists of a disposable sensor that combines a serum chemical detection system with a transmitter and receiver that collect, store, and display BG data. A stylet introduces the sensor through the skin and positions the tip to contact the interstitial fluid. The body of the sensor, which contains the transmitter, is affixed to shaved skin using a mild adhesive (Figure 1). An incorporated chemical reaction platform metabolizes interstitial glucose to generate an electrical signal that is proportional to its concentration.15 A description of the use of an FGM device in small animals is available.36

A sensor unit from a flash device adhered to the skin of a diabetic cat. A manufacturer-provided device easily applies the small sensor unit (35-mm diameter × 5-mm height) to the shaved area. The sensor uses a flexible filament in contact with the interstitial fluid to measure BG every 60 seconds and data storage capacity to record BG data. Wireless technology transfers BG data stored in the sensor unit to a handheld reader unit.
Interventional vs Dose Monitoring
When considering methods of glucose monitoring, it is worth drawing distinctions between BG monitoring performed to determine a patient’s global response to a particular dose of insulin (ie, dose monitoring) and monitoring performed to determine whether a patient’s immediate glycemic status requires correction (ie, interventional monitoring). Both can be accomplished through available techniques, have the same advantages and disadvantages, and can be used in making therapeutic decisions. In practice, however, these are very different approaches to managing glycemia (Figure 2).
Monitoring BG in veterinary patients generally serves to assess the larger picture of insulin response and BG control over the day rather than as a guide for day-to-day changes in therapy. Dose monitoring can be useful and provide helpful information, but the use of interventional monitoring should be considered cautiously. Although some pet owners may be interested in and eager to attempt interventional monitoring and make insulin adjustments, the author does not recommend it, as there has been little evidence to show that the effort and expense actually improve long-term outcomes or reduce complications, and the very stringent targets for BG control involve increased risk for hypoglycemic events in human and, probably, veterinary patients. Studies addressing these concerns are limited. In a small group of cats receiving at-home monitoring to achieve tight BG control, complication rate was low,20 but constant care and anxiety regarding hypoglycemia are common concerns among pet owners and chronic or recurrent hypoglycemia can lead to increased patient morbidity and poor quality of life.1,2 Some clinicians use a modified approach to interventional monitoring described above by having owners check BG immediately before an insulin dose and use the information to modify the dose as necessary. An advantage of this approach is the opportunity to reduce the likelihood of hypoglycemia, but the clinician must provide the owner with clear goals and guidelines for making dose decisions.

Effects of different monitoring strategies on the BG curve. The red line shows a theoretical BG curve following an insulin injection at the 0-hour mark. Within 6 hours of injection, BG returned to the preinsulin level. At this point (A), no action occurs if the dose monitoring strategy is used. However, if the interventional monitoring strategy is used, an additional insulin injection is indicated, as BG exceeds the desired target range (≤250 mg/dL). The subsequent response (gray line) brings BG into an acceptable range. At the 12-hour mark (B), the patient with dose monitoring (red line) received a scheduled second insulin injection, but the patient with interventional monitoring received no insulin, as BG values were in the target range. Without additional intervention, both patient curves were similar (black line) for the remainder of the day. Adopting a strict interventional monitoring strategy requires additional insulin be provided at the 16-hour mark when BG again exceeded the target range.
Regardless of the method used to obtain a BG curve, comparison with other measures used to assess BG control (eg, clinical evaluation, markers of long-term glycemic control) can help validate results. The BG curve is especially helpful in detecting hypoglycemic events during testing. Hypoglycemia typically reflects an excess of insulin and should prompt dose reduction. Curve analysis can also demonstrate persistent hyperglycemia, which is consistent with poor glycemic control. Troubleshooting persistent hyperglycemia is more difficult than troubleshooting hypoglycemia, as the former can have numerous causes (eg, poor compliance, problems with insulin administration, underdosing, insulin resistance).
A major limitation of the BG curve is imposed by biologic variability that impacts day-to-day insulin action. Depending on insulin type and formulation used, absorption and activity in humans under experimental conditions can vary from 15% to 50% day to day.21 Variability is typically greater in clinical patients,22 with inconsistent or unpredictable changes in glycemia even after administration of equivalent doses of the same insulin. Numerous factors, including the patient’s emotional state (eg, stress or anxiety), exercise, body temperature, and comorbidities, among others, may contribute to variability.23
The veterinary literature contains examples of the effect of biologic variability on BG curve data. In a study, dogs receiving the same insulin type and dose showed marked variability in routinely determined BG curve parameters, including minimum, maximum, and mean BG concentrations and time to nadir, on 12-hour BG curves obtained 24 hours apart.24 In that study, curve analysis resulted in a different insulin treatment recommendation in nearly 45% of paired curves and treatment recommendations were frequently opposite (ie, one curve of the pair indicated a need for a dose increase and the other indicated a need for a dose decrease).
Conclusion
No single monitoring tool or combination has been shown to provide significant, measurable advantages in diabetic dogs or cats. Reliance on a single tool is discouraged. Effective monitoring should incorporate several methods that assess different aspects of glycemic control. A flexible and practical monitoring program that aims to provide objective information while balancing patient and owner needs can engage the pet owner as a primary caregiver, enhance compliance, and strengthen the clinician–pet owner relationship.